BajaNomad

New U.N. report out on climate change. Impact on Baja?

 Pages:  1  2

gnukid - 11-5-2014 at 09:44 PM


gnukid - 11-5-2014 at 09:47 PM


gnukid - 11-5-2014 at 09:54 PM


gnukid - 11-5-2014 at 09:59 PM

Human Contribution to global Co2

wessongroup - 11-5-2014 at 10:05 PM

Quote:
Originally posted by gnukid


This graph, based on the comparison of atmospheric samples contained in ice cores and more recent direct measurements, provides evidence that atmospheric CO2 has increased since the Industrial Revolution. (Credit: Vostok ice core data/J.R. Petit et al.; NOAA Mauna Loa CO2 record.)

These findings are based on samples taken and subsequent laboratory analysis to determine what existed in the atmosphere at various times in history

It shows clearly that there is in fact an increase of CO2 production , by man, into the atmosphere and is and will have an impact

Global Analysis - September 2014

Global Highlights

The combined average temperature over global land and ocean surfaces for September 2014 was the highest on record for September, at 0.72°C (1.30°F) above the 20th century average of 15.0°C (59.0°F).

The global land surface temperature was 0.89°C (1.60°F) above the 20th century average of 12.0°C (53.6°F), the sixth highest for September on record. For the ocean, the September global sea surface temperature was 0.66°C (1.19°F) above the 20th century average of 16.2°C (61.1°F), the highest on record for September and also the highest on record for any month.

The combined global land and ocean average surface temperature for the January–September period (year-to-date) was 0.68°C (1.22°F) above the 20th century average of 14.1°C (57.5°F), tying with 1998 as the warmest such period on record.

http://www.ncdc.noaa.gov/sotc/global/

[Edited on 11-6-2014 by wessongroup]

[Edited on 11-10-2014 by BajaNomad]

gnukid - 11-5-2014 at 10:05 PM


wessongroup - 11-5-2014 at 10:14 PM


[Edited on 11-6-2014 by wessongroup]

Skipjack Joe - 11-6-2014 at 01:42 AM

Quote:
Originally posted by gnukid


I'm ashamed to say I watched this garbage.

Besides being garbage it looks as though this video has been doctored. To me it looks like it's been edited and spliced.

wessongroup - 11-6-2014 at 03:45 PM

Qualitative

Quote:
Originally posted by Skipjack Joe
Quote:
Originally posted by gnukid


I'm ashamed to say I watched this garbage.

Besides being garbage it looks as though this video has been doctored. To me it looks like it's been edited and spliced.


Quantitative

Quote:
Originally posted by wessongroup
Quote:
Originally posted by gnukid


This graph, based on the comparison of atmospheric samples contained in ice cores and more recent direct measurements, provides evidence that atmospheric CO2 has increased since the Industrial Revolution. (Credit: Vostok ice core data/J.R. Petit et al.; NOAA Mauna Loa CO2 record.)

These findings are based on samples taken and subsequent laboratory analysis to determine what existed in the atmosphere at various times in history

It shows clearly that there is in fact an increase of CO2 production , by man, into the atmosphere and is and will have an impact

Global Analysis - September 2014

Global Highlights

The combined average temperature over global land and ocean surfaces for September 2014 was the highest on record for September, at 0.72°C (1.30°F) above the 20th century average of 15.0°C (59.0°F).

The global land surface temperature was 0.89°C (1.60°F) above the 20th century average of 12.0°C (53.6°F), the sixth highest for September on record. For the ocean, the September global sea surface temperature was 0.66°C (1.19°F) above the 20th century average of 16.2°C (61.1°F), the highest on record for September and also the highest on record for any month.

The combined global land and ocean average surface temperature for the January–September period (year-to-date) was 0.68°C (1.22°F) above the 20th century average of 14.1°C (57.5°F), tying with 1998 as the warmest such period on record.

http://www.ncdc.noaa.gov/sotc/global/

[Edited on 11-6-2014 by wessongroup]


[Edited on 11-10-2014 by BajaNomad]

gnukid - 11-6-2014 at 03:53 PM


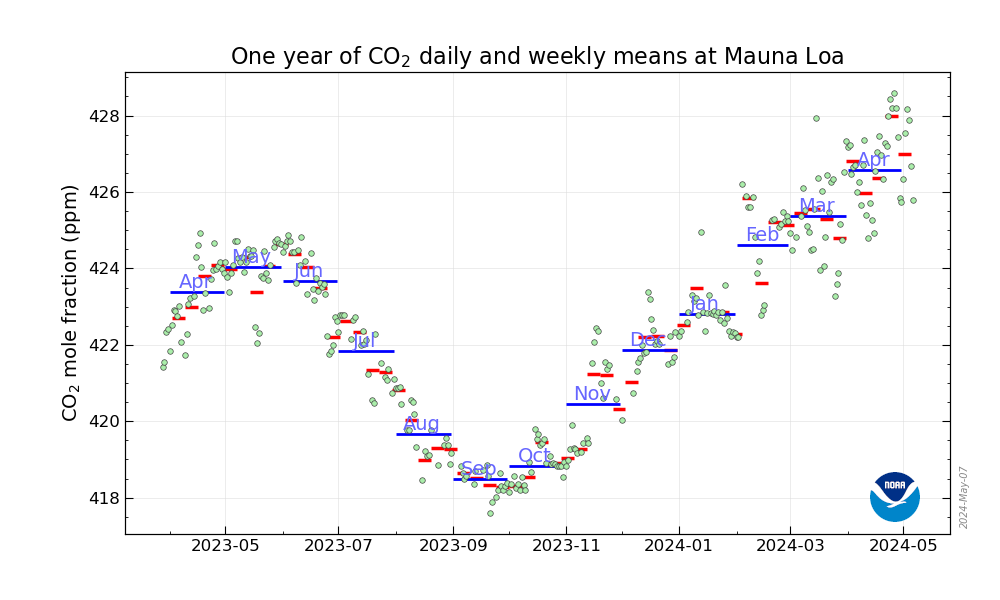
Source: http://www.esrl.noaa.gov/gmd/ccgg/trends/weekly.html

Trends 2014:

Coldest summer on record at the North Pole
Highest August Arctic ice extent since 2006
Record high August Antarctic ice extent
No major hurricane strikes for eight years
Slowest tornado season on record
No global warming for 17 years
Second slowest fire season on record
Four of the five snowiest northern hemisphere winters have occurred since 2008

gnukid - 11-6-2014 at 03:57 PM

Testimony to UN on agriculture's affect on climate change:


wessongroup - 11-6-2014 at 04:02 PM

Outstanding ... one day of sampling, lets move with those findings for the entire earth ... or Gores electric bill .... :lol::lol:

the other graph represents 650,000 years of sample data which clearly demostrates the increase in CO2 emission over the past 150 plus years

Quote:
Originally posted by wessongroup
Qualitative

Quote:
Originally posted by Skipjack Joe
Quote:
Originally posted by gnukid


I'm ashamed to say I watched this garbage.

Besides being garbage it looks as though this video has been doctored. To me it looks like it's been edited and spliced.


Quantitative

Quote:
Originally posted by wessongroup
Quote:
Originally posted by gnukid


This graph, based on the comparison of atmospheric samples contained in ice cores and more recent direct measurements, provides evidence that atmospheric CO2 has increased since the Industrial Revolution. (Credit: Vostok ice core data/J.R. Petit et al.; NOAA Mauna Loa CO2 record.)

These findings are based on samples taken and subsequent laboratory analysis to determine what existed in the atmosphere at various times in history

It shows clearly that there is in fact an increase of CO2 production , by man, into the atmosphere and is and will have an impact

Global Analysis - September 2014

Global Highlights

The combined average temperature over global land and ocean surfaces for September 2014 was the highest on record for September, at 0.72°C (1.30°F) above the 20th century average of 15.0°C (59.0°F).

The global land surface temperature was 0.89°C (1.60°F) above the 20th century average of 12.0°C (53.6°F), the sixth highest for September on record. For the ocean, the September global sea surface temperature was 0.66°C (1.19°F) above the 20th century average of 16.2°C (61.1°F), the highest on record for September and also the highest on record for any month.

The combined global land and ocean average surface temperature for the January–September period (year-to-date) was 0.68°C (1.22°F) above the 20th century average of 14.1°C (57.5°F), tying with 1998 as the warmest such period on record.

http://www.ncdc.noaa.gov/sotc/global/

[Edited on 11-6-2014 by wessongroup]


There is "talk" and then there are "facts" ... see above :biggrin::biggrin:

[Edited on 11-6-2014 by wessongroup]

[Edited on 11-10-2014 by BajaNomad]

Skipjack Joe - 11-6-2014 at 04:16 PM

Quote:
Originally posted by gnukid


Source: http://www.esrl.noaa.gov/gmd/ccgg/trends/weekly.html

Trends 2014:

Coldest summer on record at the North Pole
Highest August Arctic ice extent since 2006
Record high August Antarctic ice extent
No major hurricane strikes for eight years
Slowest tornado season on record
No global warming for 17 years
Second slowest fire season on record
Four of the five snowiest northern hemisphere winters have occurred since 2008


Shame on you gnukid. I went to the source you provided -

http://www.esrl.noaa.gov/gmd/ccgg/trends/weekly.html

And found that you had chosen a weekly report to post here when there was the following historic report right next to it which you chose not to post. You have a history of cherry picking data from the internet and presenting them here to numerically prove something.

I suggest you stick to Mauna Loa macademia nuts. Something you are more suited for.


gnukid - 11-6-2014 at 04:22 PM

Clearly, there is change in CO2 ppm, however, attributing the increase to global climate change is not likely, more likely the opposite temperature drives CO2.

Note that in prehistoric times, before industrialization, CO2 was in much higher ppm during periods of greater diversity. CO2 feeds plants which feeds animals. CO2 is life force. Furthermore, note that CO2 is a very minor atmospheric gas.

Now let's focus on reducing actual pollution we can control, such as military weapons detonation, agricultural poison, medical waste dumping, nuclear waste and geo-engineering.

Ateo - 11-6-2014 at 07:19 PM

Let's talk about GMO's instead.

:lol::lol::lol::lol::lol::lol::lol:

wessongroup - 11-6-2014 at 07:39 PM

The graph is representative of samples obtained from "ice core" sampling and shows exactly what was "found".

http://en.wikipedia.org/wiki/European_Project_for_Ice_Coring...

Again the time frame is 650,000 years, which would take one back to the (Calabrian is a subdivision of the Pleistocene Epoch of the Geologic time scale. ~1.8 Ma.—781,000 years ago ± 5,000 years, a period of ~1.019 million years.) which has not confirmed the "theory" that Greenhouse Effect was on going at anytime for at lest the last 650,000, through scientific sampling with results which in fact support the contention that man has, since the development of the internal combustion engine and the subsequent need for "oil" has lead us to the point in time today and is also illustrated in the graph below

The fact is that there has been increased pollutants in our environment from man's progress in the fields of Chemistry and/or Industrialization

Hence the need for the Environmental Protection Agency in 1970, along with a long list of other agencies and Laws and regulations to "manage" to some degree the negative impact of same to: earth, air, water, fauna and flora over the past 50 years

The first forceful example of "industrialization" vast impact on the planet was the findings in the early 60's ... showing just how wide the impact of just one chemical (DDT) was having on various living organisms within the environment .. Its use was discontinued in the United States, however, it is still use due to its cost and effectiveness in some areas of the world still, mostly in the very poor countries ... and has a tolerance established for how much one can eat with their food, as it is persistence in the environment ... the "parent" ai and its metabolites

That there are countless example of negative environment impacts to the soil, water and air from industrialization should not be in dispute, rather the quantity of "substances" which are introduced, daily, weekly, monthly, yearly ... et al that have a negative impact, measured by science, not talking heads

Personally, I'd rather not wait until the "rivers" are catching fire again, or large areas are made unusable from contamination ... and that would apply to the: soil, water and air ... they are necessary to grow food, provide shelter, medicines et al, but not at the cost of an environment which allows us to exist in the life form we know as "humans"

Quote:
Originally posted by wessongroup
Quote:
Originally posted by gnukid


This graph, based on the comparison of atmospheric samples contained in ice cores and more recent direct measurements, provides evidence that atmospheric CO2 has increased since the Industrial Revolution. (Credit: Vostok ice core data/J.R. Petit et al.; NOAA Mauna Loa CO2 record.)


Global Analysis - September 2014

Global Highlights

The combined average temperature over global land and ocean surfaces for September 2014 was the highest on record for September, at 0.72°C (1.30°F) above the 20th century average of 15.0°C (59.0°F).

The global land surface temperature was 0.89°C (1.60°F) above the 20th century average of 12.0°C (53.6°F), the sixth highest for September on record. For the ocean, the September global sea surface temperature was 0.66°C (1.19°F) above the 20th century average of 16.2°C (61.1°F), the highest on record for September and also the highest on record for any month.

The combined global land and ocean average surface temperature for the January–September period (year-to-date) was 0.68°C (1.22°F) above the 20th century average of 14.1°C (57.5°F), tying with 1998 as the warmest such period on record.

http://www.ncdc.noaa.gov/sotc/global/

[Edited on 11-6-2014 by wessongroup]


These are quantitative "facts" which were developed from scientific investigation, which just didn't start yesterday

Our environment is better defined today compare to 50 years ago, not forgetting the instrumentation which was not around 50 years ago... as, there was concern from some and the arguments haven't changed IMHO ... trust me :):)

No argument on the need to "control" pollution, from many sources which have negative impact on our environment ... it the right thing to do for life and common sense

[Edited on 11-7-2014 by wessongroup]

[Edited on 11-10-2014 by BajaNomad]

grizzlyfsh95 - 11-6-2014 at 08:56 PM

Me thinks thou doth protest too much.

gnukid - 11-7-2014 at 03:02 AM

Landscapes & Cycles

chuckie - 11-7-2014 at 05:54 AM

Could we please see all those charts and pictures again?

wessongroup - 11-7-2014 at 08:43 AM

Sorry if the "facts" are upsetting to some ... but, since you asked ... here's the graph is again ... along with a graph on oil production from the 1930s to 2013 in barrels per day production

Isn't that amazing the graph of increased oil production is reflected in the graph of CO2 increase ...

Naw, couldn't be a scientific relationship between oil production and use, with increased CO2 levels being detected in our "atmosphere" :lol::lol:

And GMO's isn't a bad one to bring up either ... or how about "Bees" ... or _____

Hey, its Friday ... have a great weekend ... :):)

This graph, based on the comparison of atmospheric samples contained in ice cores and more recent direct measurements, provides evidence that atmospheric CO2 has increased since the Industrial Revolution. (Credit: Vostok ice core data/J.R. Petit et al.; NOAA Mauna Loa CO2 record.)


The Preindustrial and/or Industrial Revolution changed everything … with the development of the “internal combustion engine” it was all over .. in 1859

"The first commercially successful internal combustion engine was created by Étienne Lenoir around 1859.[1]”

Scientific American advised in September 1860 the Parisian newspaper Cosmos had pronounced the steam age over,[5]

http://en.wikipedia.org/wiki/Étienne_Lenoir

http://en.wikipedia.org/wiki/Internal_combustion_engine

Graph of oil production from 1930 to 2013


Based on the two graphs which are "factual" ... would appear that anything over 10 million barrel's per day, has a significant impact ... just saying

And yes, it will impact Baja too ... its in the environment too

[Edited on 11-7-2014 by wessongroup]


[Edited on 11-10-2014 by BajaNomad]

gnukid - 11-7-2014 at 10:30 AM

Please keep in mind, oil/coal production is what makes it possible for productivity and middle class living in extreme cold and hot conditions. It is what allows people to travel, work effectively, survive and have some security.

3 billion people still have no power and they suffer while living in inefficient circumstances unable to participate in high productivity, they have much higher birth rates to overcome low life expectancy. Oil energy has reduced birth rates substantially.

dtbushpilot - 11-7-2014 at 11:09 AM

You're treading on thin ice gnukid, they are going to start yelling at you and calling you names for having a differing view.

wessongroup - 11-7-2014 at 11:46 AM

I'm not unaware of the difficulties in proving food, shelter and comfortable life

However, what we are seeing is a "negative feedback loop" from our environment, from same

Not aware of anyone who is saying this is an easy one ... not by a long shot

Just producing "food" without "chemicals" is a very difficult proposition ... let alone maintaining a Global Economy and a higher standard of living for all on the planet

I appreciate gnukid's input ... we typically agree on many things, we just don't view this issue the same, at this time

And this is true with many on this issue .... economic "growth" and the impact of same on the environment

Given the effectiveness of pervious attempts to decrease the amount of pollution, and where we are currently ... a change will have to be developed thru science to achieve a long term solution IMHO ... not thru "Finance" nor "Government"

[Edited on 11-7-2014 by wessongroup]

additionally oil has also produce this:

"Hazardous air pollutants, also known as toxic air pollutants or air toxics, are those pollutants that cause or may cause cancer or other serious health effects, such as reproductive effects or birth defects, or adverse environmental and ecological effects. EPA is required to control 187 hazardous air pollutants. Examples of toxic air pollutants include benzene, which is found in gasoline; perchlorethlyene, which is emitted from some dry cleaning facilities; and methylene chloride, which is used as a solvent and paint stripper by a number of industries. Through appropriate rulemaking, the Clean Air Act list can be modified. A current list of modifications is available. Some clarification on certain pollutant aggregation (PDF) (8pp, 33k) is also available."

http://www.epa.gov/ttnatw01/pollsour.html


[Edited on 11-7-2014 by wessongroup]

Oh, btw ... a nice day here in SoCal ... :):)

[Edited on 11-7-2014 by wessongroup]

MitchMan - 11-7-2014 at 12:41 PM

Saw an interesting discussion between a liberal pundit and a spokesman for the coal industry. There was a great and significant point made by the spokesman.

When asked what kind of future world the spokesman would want for his kids and grand kids here in the United States, that is, a country dependent on eco-friendly sources of energy or the evil coal. The spokesman said that, in the big real life picture, China and other emerging countries were going to continue and increase their coal usage in proportions that would completely dwarf any coal usage that the US could be capable of achieving, even if it wanted to, and therefore, the amount of coal energy that the USA would use or not use would be irrelevant to the effect on the global environment. Therefore, he would promote using coal for energy in the USA to at least reap financial benefit, all things being considered.

MitchMan - 11-7-2014 at 12:43 PM

Hey guys, learn to use Photoshop to reduce the size of your photos, images, and graphs. It's easy and fast.

MitchMan - 11-7-2014 at 12:46 PM

With just two graphs, wessongroup, you have said it all. Good job.

While the issue is truly a complicated one with all kinds of variables, physical dynamics, and differing measurement techniques and results, there is sufficient agreement on salient facts by both sides to this issue to actually come to a conclusion.

Both sides agree that global temperature changes are due to external forcings such as increased concentrations of greenhouse gases, solar luminosity, volcanic eruptions, and variations in Earth's orbit around the Sun. And, both sides agree with the laws of thermodynamics and chemistry. Both sides agree, SHOULD THER BE global warming that consistently trends to certain increased levels, that would be a change that alters climate and would be damaging to our world and our human existence, as we know it.

The issue comes down to whether or not there has been enough of an increase in greenhouse effect (to put the absorption/re-radiation out of balance radiating more heat back to earth than radiating away from the earth’s surface) to actually trend an increase in global warming, and, if so, was that cause due to man’s increased spewing of greenhouse gases (particularly CO2) at an accelerating rate due to the use of fossil fuels since the beginning of the industrialization period?

There are at least 10 indicators that are used to ascertain and track global temperature, changes and trends. These indicators include but are not limited to sea level, glacier retreat, global humidity, changes in snow cover and ice extent, anomalous changes in weather, water volume of glacier/ice/snow melting, average temperatures on land and in the ocean and at its surface, global average temperature itself.

Please note that time frames for consideration of indicators must be appropriate in length to be meaningful. To rest one’s case on an inadequate time frame is not reasonable and has no credibility.

Evidence of Global Warming Since Beginning of Industrial Era
Anomalous Increase in atmospheric concentration of CO2
Anomalous Increase in global temperatures
Anomalous Sea and surface temperature increase
Anomalous Frequency of hurricanes
Anomalous Reduction in extent of sea ice
Anomalous Sea level rise
Anomalous Melting glaciers and artic ice and polar caps
Anomalous Increase in ocean depth temperature
Anomalous Reduction of polar extent of sea ice in the Arctic Ocean
Anomalous accelerated increase to many of the above since 1950
No sufficient and adequate anomalous "natural" causes for global warming have been confirmed.


Allow me to quote Pompano from this thread:
Quote:
posted on 11-2-2014 at 04:28 PM
“When trying to understand the world, we should consider theories. Really, it's the facts that matter; and if the facts change, our theories should too.”


If you acknowledge the fact that the atmosphere has had an anomalous increase in CO2 composition since the beginning of the industrial era and that such increase in CO2 does in fact increase the greenhouse effect AND you can't disprove the anomalous trend in the abovementioned indicators, how can you possibly deny global warming is our situation?

Now, if you disagree with the conclusion of the current existence of a damaging trend of global warming/climate change, please posit your arguments that adequately and sufficiently refute and disprove the above.

[Edited on 11-7-2014 by MitchMan]

[Edited on 11-7-2014 by MitchMan]

Skipjack Joe - 11-7-2014 at 02:10 PM

Quote:
Originally posted by MitchMan
Saw an interesting discussion between a liberal pundit and a spokesman for the coal industry. There was a great and significant point made by the spokesman.

When asked what kind of future world the spokesman would want for his kids and grand kids here in the United States, that is, a country dependent on eco-friendly sources of energy or the evil coal. The spokesman said that, in the big real life picture, China and other emerging countries were going to continue and increase their coal usage in proportions that would completely dwarf any coal usage that the US could be capable of achieving, even if it wanted to, and therefore, the amount of coal energy that the USA would use or not use would be irrelevant to the effect on the global environment. Therefore, he would promote using coal for energy in the USA to at least reap financial benefit, all things being considered.


Unfortunately China has a similar attitude that the US has: "Why should we curtail coal production when the other major producers are not doing it". That kind of attitude gets us nowhere. It provides a perfect reason to do nothing - which is the objective to start out with.

This is not much different than the finger pointing that goes on between recreational and commercial fishing in baja. Why shouldn't I return from asuncion with wheelbarrows full of yellowtail when the commercials are taking so much more.

MitchMan - 11-7-2014 at 02:17 PM

New versions of Photoshop Elements is about $60 to $90 USD depending on where you get it. Buy an old version, from ver 5 forward and get it cheap and keep it forever. You will be able to do most anything you need to a photo. You don't need the most recent versions at all to resize an image. You certainly don't need any of the CS versions unless you are a professional and have to process hundreds of photos at a time.

Not sure, but it may be possible to resize an image with Picassa, which is a free online sfwe that is pretty good for working on digital images.

MitchMan - 11-7-2014 at 02:24 PM

I agree, Skipjack. The higher ground should be observed, even if everybody else doesn't. The coal representative never really answered the actual question which was " which world do you want your kids and grand kids to grow up in". He just 'rationalized' a response which was nothing more than an excuse to continue burning coal and not addressing directly the moral aspect of the issue.

redhilltown - 11-8-2014 at 01:16 AM

I think the underbelly of those that deny any sense of climate change is "maybe it is true, but even if WE stop belching carbon into the air, India, China, Mexico and others will not stop so why should we hurt our economy to help THEM?". Outside of the facts and the science, it is a compelling argument to many.

Ateo - 11-8-2014 at 07:30 AM

None of this matters. Jesus is coming back soon. :saint:

monoloco - 11-8-2014 at 07:33 AM

Quote:
Originally posted by Ateo
None of this matters. Jesus is coming back soon. :saint:
And man, is he peeed!

MitchMan - 11-8-2014 at 09:40 AM

I currently teach photography part time. Half of the class is lecture on the fundamentals of digital photography, the other half is on teaching Photoshop fundamentals with specific regard to processing digital images.

I get the question every semester: "what is the difference between CS and Elements?"

I tell them that, for the most part, with Photoshop Elements, you can accomplish 95% of what you can accomplish with the CS version as far as processing a digital image. And, I tell them, for the class, any version of Elements (past version 3) and CS will allow them to do everything they need to do on an image that is necessary to process it. CS is for professionals that need to process hundreds of photos quickly and is better (more efficient) to do graphic alterations to images. So, in my view, if you are not a professional photographer, any old version of Elements will do just fine.

The key to photoshop is 1) knowing layers 2)knowing what a pixel is 3)understanding RGB color. Then you can pick up any photoshop-like software of any version and be off and running.

David K - 11-8-2014 at 10:22 AM

All photos should be sized to not distort forum pages.

The max size here is 800 pixels wide.

When you upload from your PC or web site onto your photo hosting site (Photobucket or other free sites) do so AFTER you have selected the upload size. 640 pixels is a large photo on this site and 800 is the absolute max. Anything more will distort the width of the forum, and can throw the image and all texts on the page off the screen and require sideways scrolling to view and read. Shrinking the monitor image just makes viewing difficult.

On Photobucket there is a small gear symbol to click on when you begin the upload process, to select an uploading size. Do it once and be done with it, all images you upload to Photobucket for sharing on Nomad or other forums will now fit.

The first post on the Nomad Photo Gallery illustrates the ease of how to do this: http://forums.bajanomad.com/viewthread.php?tid=65085

MitchMan - 11-8-2014 at 10:27 AM

I don't know anything about Lightroom. Never have seen the software. My students ask me about it all the time, but I am quite satisfied with CS and Elements and those two do everything I need to do.

Should be easy to find out though. Sorry I can't help.

Skipjack Joe - 11-8-2014 at 11:40 AM

Lightroom - $75
Photoshop CS6 - $600

As they say: enough said.

JoeJustJoe - 11-8-2014 at 01:30 PM

Why isn't this thread in the OT?

There is no use in arguing with a global warming denier, when overwhelming the majority of scientist who study this issue, and don't work for "Exxon" agree Global warning is real, and it's really being accelerated greatly by man and the industrial age.

If a forum member came to "BN" and said the Earth is flat. Would you take the time to try to convince then the Earth is really round, especially when he is telling you to open your eyes, and you could see the Earth is flat.

It's really a big waste of time trying to debate a GW "denier.

wessongroup - 11-8-2014 at 04:36 PM

:lol::lol:

wessongroup - 11-8-2014 at 10:35 PM

Hey, isn't talking about the weather fun ... :lol::lol::lol:

elgatoloco - 11-9-2014 at 05:46 PM

Michael Savage :lol::lol:

gnukid - 11-9-2014 at 06:39 PM

On climate, the Right is right – Global temperature update: the Pause is still 18 years 1 month
November 7, 2014
By Christopher Monckton of Brenchley

One of the most interesting statistics from the recent mid-terms was the New York Times’ exit poll (Fig. 1), showing that more than two-thirds of “Democrat” voters thought climate change was a serious problem. Five-sixths of Republicans didn’t.


Figure 1. The New York Times’ exit poll showing the partisan divide on climate.

Put this interesting statistic with another interesting statistic: the growth in the CO2 emissions from the burning of fossil fuels. In 1988, the year in which IPeCaC was founded and James Hansen first bleated about the imagined threat of “global warming” before Congress after Senator Tim Wirth had had the air-conditioning turned off in the hearing room, the world emitted 22 million tonnes of CO2 a year.

In 2013, just 25 years later, 35 million tonnes of CO2 were emitted. For all the chatter about the need to cut CO2 emissions, for all the taxes and fines and subsidies and profiteering, for all the pompous posturing at international grandstanding sessions and global gabfests, there is nothing to show but a 50% increase in the world’s annual emissions of CO2.

If the world really thought global warming was a serious problem, it is not likely that so large an increase in the emission of the supposedly dangerous (but actually innocuous and beneficial) trace gas CO2 would have been allowed to occur.

So, should anyone have been worried? On the data, the answer is No. Since October 1996 there has been no global warming at all (Fig. 2). This month’s RSS temperature plot comes within a whisker of pushing up the period without any global warming from 18 years 1 month to 18 years 2 months: however, on a strict interpretation the period without warming remains at 18 years 1 month. Within a month or two, the current weakish el Nino may begin to influence global temperatures, shortening the Great Pause. However, if the el Nino is followed by a la Nina the Pause could lengthen again by late next year – perhaps even in time for the Paris climate summit of December 2015, at which the next major attempt to introduce a global “government” on the back of the climate scare will be made.


Figure 2. The least-squares linear-regression trend on the RSS satellite monthly global mean surface temperature anomaly dataset shows no global warming for 18 years 1 month since October 1996.

The hiatus period of 18 years 1 month, or 217 months, is the farthest back one can go in the RSS satellite temperature record and still show a sub-zero trend.


Figure 3. Near-term projections of warming at a rate equivalent to 2.8 [1.9, 4.2] K/century, made with “substantial confidence” in IPCC (1990), January 1990 to October 2014 (orange region and red trend line), vs. observed anomalies (dark blue) and trend (bright blue) at less than 1.4 K/century equivalent, taken as the mean of the RSS and UAH satellite monthly mean lower-troposphere temperature anomalies.

A quarter-century after 1990, the global-warming outturn to date – expressed as the least-squares linear-regression trend on the mean of the RSS and UAH monthly global mean surface temperature anomalies – is 0.34 Cº, equivalent to just 1.4 Cº/century, or a little below half of the central estimate in IPCC (1990) and well below even the least estimate (Fig. 3).

The Great Pause is a growing embarrassment to those who had told us with “substantial confidence” that the science was settled and the debate over. Nature had other ideas. Though more than 50 more or less implausible excuses for the Pause are appearing in nervous reviewed journals and among proselytizing scientists, the possibility that the Pause is occurring because the computer models are simply wrong about the sensitivity of temperature to manmade greenhouse gases can no longer be dismissed.

Remarkably, even the IPCC’s latest and much reduced near-term global-warming projections are also excessive (Fig. 4).


Figure 4. Predicted temperature change, January 2005 to October 2014, at a rate equivalent to 1.7 [1.0, 2.3] Cº/century (orange zone with thick red best-estimate trend line), compared with the observed anomalies (dark blue) and zero real-world trend (bright blue), taken as the average of the RSS and UAH satellite lower-troposphere temperature anomalies.

In 1990, the IPCC’s central estimate of near-term warming was higher by two-thirds than it is today. Then it was 2.8 C/century equivalent. Now it is just 1.7 Cº equivalent – and, as Fig. 4 shows, even that is proving to be a substantial exaggeration.

On the RSS satellite data, there has been no global warming statistically distinguishable from zero for more than 26 years. None of the models predicted that, in effect, there would be no global warming for a quarter of a century.

The Great Pause may well come to an end by this winter. An el Niño event is underway and would normally peak during the northern-hemisphere winter. There is too little information to say how much temporary warming it will cause, though. The temperature spikes of the 1998, 2007, and 2010 el Niños are evident in Figs. 1-4.

El Niños occur about every three or four years, though no one is entirely sure what triggers them. They cause a temporary spike in temperature, often followed by a sharp drop during the la Niña phase, as can be seen in 1999, 2008, and 2011-2012, where there was a “double-dip” la Niña that is one of the excuses for the Pause.

The ratio of el Niños to la Niñas tends to fall during the 30-year negative or cooling phases of the Pacific Decadal Oscillation, the latest of which began in late 2001. So, though the Pause may pause or even shorten for a few months at the turn of the year, it may well resume late in 2015 . Either way, it is ever clearer that global warming has not been happening at anything like the rate predicted by the climate models, and is not at all likely to occur even at the much-reduced rate now predicted. There could be as little as 1 Cº global warming this century, not the 3-4 Cº predicted by the IPCC.

Key facts about global temperature

Ø The RSS satellite dataset shows no global warming at all for 217 months from October 1996 to October 2014. That is more than half the 429-month satellite record.

Ø The global warming trend since 1900 is equivalent to 0.8 Cº per century. This is well within natural variability and may not have much to do with us.

Ø The fastest measured warming trend lasting ten years or more occurred over the 40 years from 1694-1733 in Central England. It was equivalent to 4.3 Cº per century.

Ø Since 1950, when a human influence on global temperature first became theoretically possible, the global warming trend has been equivalent to below 1.2 Cº per century.

Ø The fastest warming rate lasting ten years or more since 1950 occurred over the 33 years from 1974 to 2006. It was equivalent to 2.0 Cº per century.

Ø In 1990, the IPCC’s mid-range prediction of near-term warming was equivalent to 2.8 Cº per century, higher by two-thirds than its current prediction of 1.7 Cº/century.

Ø The global warming trend since 1990, when the IPCC wrote its first report, is equivalent to below 1.4 Cº per century – half of what the IPCC had then predicted.

Ø Though the IPCC has cut its near-term warming prediction, it has not cut its high-end business as usual centennial warming prediction of 4.8 Cº warming to 2100.

Ø The IPCC’s predicted 4.8 Cº warming by 2100 is well over twice the greatest rate of warming lasting more than ten years that has been measured since 1950.

Ø The IPCC’s 4.8 Cº-by-2100 prediction is almost four times the observed real-world warming trend since we might in theory have begun influencing it in 1950.

Ø From September 2001 to September 2014, the warming trend on the mean of the 5 global-temperature datasets is nil. No warming for 13 years 1 month.

Ø Recent extreme weather cannot be blamed on global warming, because there has not been any global warming. It is as simple as that.

Technical note

Our latest topical graph shows the least-squares linear-regression trend on the RSS satellite monthly global mean lower-troposphere dataset for as far back as it is possible to go and still find a zero trend. The start-date is not “cherry-picked” so as to coincide with the temperature spike caused by the 1998 el Niño. Instead, it is calculated so as to find the longest period with a zero trend.

Terrestrial temperatures are measured by thermometers. Thermometers correctly sited in rural areas away from manmade heat sources show warming rates appreciably below those that are published. The satellite datasets are based on measurements made by the most accurate thermometers available – platinum resistance thermometers, which provide an independent verification of the temperature measurements by checking via spaceward mirrors the known temperature of the cosmic background radiation, which is 1% of the freezing point of water, or just 2.73 degrees above absolute zero. It was by measuring minuscule variations in the cosmic background radiation that the NASA anisotropy probe determined the age of the Universe: 13.82 billion years.

The graph is accurate. The data are lifted monthly straight from the RSS website. A computer algorithm reads them down from the text file, takes their mean and plots them automatically using an advanced routine that automatically adjusts the aspect ratio of the data window at both axes so as to show the data at maximum scale, for clarity.

The latest monthly data point is visually inspected to ensure that it has been correctly positioned. The light blue trend line plotted across the dark blue spline-curve that shows the actual data is determined by the method of least-squares linear regression, which calculates the y-intercept and slope of the line via two well-established and functionally identical equations that are compared with one another to ensure no discrepancy between them. The IPCC and most other agencies use linear regression to determine global temperature trends. Professor Phil Jones of the University of East Anglia recommends it in one of the Climategate emails. The method is appropriate because global temperature records exhibit little auto-regression.

Dr Stephen Farish, Professor of Epidemiological Statistics at the University of Melbourne, kindly verified the reliability of the algorithm that determines the trend on the graph and the correlation coefficient, which is very low because, though the data are highly variable, the trend is flat.

RSS itself is now taking a serious interest in the length of the Great Pause. Dr Carl Mears, the senior research scientist at RSS, discusses it at remss.com/blog/recent-slowing-rise-global-temperatures.

Dr Mears’ results are summarized in Fig. T1:


Figure T1. Output of 33 IPCC models (turquoise) compared with measured RSS global temperature change (black), 1979-2014. The transient coolings caused by the volcanic eruptions of Chichón (1983) and Pinatubo (1991) are shown, as is the spike in warming caused by the great el Niño of 1998.

Dr Mears writes:

“The denialists like to assume that the cause for the model/observation discrepancy is some kind of problem with the fundamental model physics, and they pooh-pooh any other sort of explanation. This leads them to conclude, very likely erroneously, that the long-term sensitivity of the climate is much less than is currently thought.”

Dr Mears concedes the growing discrepancy between the RSS data and the models, but he alleges “cherry-picking” of the start-date for the global-temperature graph:

“Recently, a number of articles in the mainstream press have pointed out that there appears to have been little or no change in globally averaged temperature over the last two decades. Because of this, we are getting a lot of questions along the lines of ‘I saw this plot on a denialist web site. Is this really your data?’ While some of these reports have ‘cherry-picked’ their end points to make their evidence seem even stronger, there is not much doubt that the rate of warming since the late 1990s is less than that predicted by most of the IPCC AR5 simulations of historical climate. … The denialists really like to fit trends starting in 1997, so that the huge 1997-98 ENSO event is at the start of their time series, resulting in a linear fit with the smallest possible slope.”

In fact, the spike in temperatures caused by the Great el Niño of 1998 is largely offset in the linear-trend calculation by two factors: the not dissimilar spike of the 2010 el Niño, and the sheer length of the Great Pause itself.

Replacing all the monthly RSS anomalies for 1998 with the mean anomaly value of 0.55 K that obtained during the 2010 el Niño and recalculating the trend from September 1996 [not Dr Mears’ “1997”] to September 2014 showed that the trend values “–0.00 C° (–0.00 C°/century)” in the unaltered data (Fig. 1) became “+0.00 C° (+0.00 C°/century)” in the recalculated graph. No cherry-picking, then.

The length of the Great Pause in global warming, significant though it now is, is of less importance than the ever-growing discrepancy between the temperature trends predicted by models and the far less exciting real-world temperature change that has been observed.

IPCC’s First Assessment Report predicted that global temperature would rise by 1.0 [0.7, 1.5] Cº to 2025, equivalent to 2.8 [1.9, 4.2] Cº per century. The executive summary asked, “How much confidence do we have in our predictions?” IPCC pointed out some uncertainties (clouds, oceans, etc.), but concluded:

“Nevertheless, … we have substantial confidence that models can predict at least the broad-scale features of climate change. … There are similarities between results from the coupled models using simple representations of the ocean and those using more sophisticated descriptions, and our understanding of such differences as do occur gives us some confidence in the results.”

That “substantial confidence” was substantial over-confidence. For the rate of global warming since 1990 is about half what the IPCC had then predicted.

wessongroup - 11-9-2014 at 07:52 PM

"gives us some confidence in the results."


Global Warming Gas, Carbon Dioxide, Found To Affect Orbiting Satellites & Space Junk

http://www.huffingtonpost.com/2012/11/12/global-warming-gas-...

This increase is 10 parts per million per decade faster than predicted by models of the upper atmosphere. Launching rockets into orbit does add carbon dioxide to the atmosphere, but the scientists calculated that such launches would have deposited only about 2,700 metric tons of carbon into the upper atmosphere between 2004 and 2012, while levels of COx apparently rose by about 20,000 metric tons in the upper atmosphere during that time.

Instead, the researchers suggest this increase was due to an unexpectedly large amount of mixing and circulation between the upper and lower layers of the atmosphere. The investigators also noted this rise in carbon dioxide levels in the upper atmosphere might explain the surprising reduction they have seen in atmospheric drag on satellites and space debris.

"The next challenge is to understand why the observed carbon dioxide trends are bigger than expected," Emmert said. "This requires the application of sophisticated, whole-atmosphere models."

[Edited on 11-10-2014 by wessongroup]

[Edited on 11-10-2014 by wessongroup]

[Edited on 11-10-2014 by wessongroup]

MitchMan - 11-9-2014 at 08:11 PM

gnukid, are you sure that your selected 18 year period is determinative and adequate to close your case because 97% of scientists (and probably more) from around the world would disagree with you. If you are going to use stats and probabilities, you have to have meaningful time periods, otherwise, you have nothing.

Your 18 year period and your other recent stats just aren't sufficient to negate the trend since, oh, 1750. Also, global warming is not just limited to surface air temps, heat is absorbed by ice and snow and then it melts. Deep ocean waters also absorb heat.

I mean, just logically to illustrate the point, if air temps don't change, but deep water temps do increase because of absorption of heat and quantities of glacier, ice caps and snow extents are anomalously shrinking because of meltage caused by their absorption of heat over relatively recent times, such meltage further evidenced by rising sea levels, well, that takes more heat doesn't it? Global warming is not limited to warming of the surface air temperature only. There are other things in other places that will store heat besides the air. Physics 101.

You wouldn't say that the summer didn't get hotter than the spring if you stayed inside your house and used your air conditioner to maintain 72 F. Obviously, your a/c kept replacing the hot air in your house with air conditioned air by taking the warmer air, removing the heat, putting the cooled air into your house and sending that excess extracted heat to the outside. The heat did increase and that increase of heat went some place else (i.e., outside), just not inside your house...the a/c transferred the heat to a different location. The additional heat did occur and it is someplace else, just not in your house.

Michael Savage? Please! I have listened to his shows many times. Talk about radical. The guy is a radical hack and you know it. Both positive and negative reviewers of his book never say that the book is anything close to a legitimate treatise. The reviews, both pro and con reveal that the book is simply more right wing ideological extremism (and everyone agrees Savage is extreme) and demagoguery than a serious objective piece of work. But, I guess that is the best you can come up with.

Republicans don't trust 'people' at all, they only trust each other. Everybody knows that.

wessongroup - 11-9-2014 at 09:07 PM

Good one, tends to go sideways quickly ... :biggrin::biggrin:

And the "genesis" .......... once again ... drum roll

Burning of petroleum products to achieve our current standard of living ... which is pretty damn good even considering the past ___X___ years

WE® humans just have to deal with it ...

It will be harder for some, than others, nothing is fair in life ... that doesn't even enter the decision making process, in most cases

Was told that once, Fair? who said it would be fair ... changed the way I looked at things


:):)

[Edited on 11-10-2014 by wessongroup]

Ateo - 11-10-2014 at 08:12 AM

I think I've said this before, but NONE of this matters because Jesus is coming back soon.

:P

Bajaboy - 11-10-2014 at 08:20 AM

Quote:
Originally posted by Ateo
I think I've said this before, but NONE of this matters because Jesus is coming back soon.

:P


And the Republicans took control....everything will be perfect now:lol:

elgatoloco - 11-10-2014 at 09:45 AM

Quote:
Originally posted by Ateo
I think I've said this before, but NONE of this matters because Jesus is coming back soon.

:P


He comes by my place weekly. He and his partner Pedro do a great job taking care of my landscaping. :saint:

monoloco - 11-10-2014 at 09:58 AM

Quote:
Originally posted by elgatoloco
Quote:
Originally posted by Ateo
I think I've said this before, but NONE of this matters because Jesus is coming back soon.

:P


He comes by my place weekly. He and his partner Pedro do a great job taking care of my landscaping. :saint:
I know him quite well myself and he prefers to be called Chuy.

Skipjack Joe - 11-10-2014 at 10:08 AM

Quote:
Originally posted by gnukid

One of the most interesting statistics from the recent mid-terms was the New York Times’ exit poll (Fig. 1), showing that more than two-thirds of “Democrat” voters thought climate change was a serious problem. Five-sixths of Republicans didn’t.


Figure 1. The New York Times’ exit poll showing the partisan divide on climate.


This alone should raise red flags for you. This breakdown should be identical in both parties. This shows that people are thinking with their hearts, not with their heads. Therefore what the masses think on this subject can be totally ignored. It shows that the people are influenced by campaigns.

Pompano - 11-10-2014 at 10:23 AM

Quote:
Originally posted by Bajaboy
Quote:
Originally posted by Ateo
I think I've said this before, but NONE of this matters because Jesus is coming back soon.

:P


And the Republicans took control....everything will be perfect now:lol:


America can only hope for a change. But....wanna bet that the IIC won't play with the other kids?

(p.s. Life is way too serious to be taken seriously.)


As to Baja and the border..

Q: What does Barack Obama call illegal aliens?
A: Undocumented democrats.

[Edited on 11-10-2014 by Pompano]

Obama-Poker-Strategy.jpg - 49kB

Jack Swords - 11-10-2014 at 10:53 AM

Interesting site about Gnukid's selected source:

http://bbickmore.wordpress.com/lord-moncktons-rap-sheet/

Jack Swords - 11-10-2014 at 11:07 AM

and so on...

http://hot-topic.co.nz/recursive-fraudery-monckton-goes-mad-...

bufeo - 11-10-2014 at 11:45 AM

^^^Those are good reads, Jack. Thanks.

grizzlyfsh95 - 11-10-2014 at 12:55 PM

Quote:
Originally posted by JoeJustJoe
Why isn't this thread in the OT?


If a forum member came to "BN" and said the Earth is flat. Would you take the time to try to convince then the Earth is really round, especially when he is telling you to open your eyes, and you could see the Earth is flat.


It's a sphere. And no, I do not work for Exxon. And no, there are no global warming deniers, there are just people who do not think that the current trend of the cooling/warming cycle is caused by Al Gores jets.

]

[Edited on 11-10-2014 by grizzlyfsh95]

MitchMan - 11-10-2014 at 03:44 PM

Thanks, Jack. All I can say is... "WOW"!

gnukid - 11-10-2014 at 04:46 PM

Quote:
Originally posted by Jack Swords
and so on...

http://hot-topic.co.nz/recursive-fraudery-monckton-goes-mad-...


Interesting to note that after Monckton's talks and appearances by Gore, Australia voted to repeal carbon taxes.

http://online.wsj.com/articles/australia-repeals-carbon-tax-...

[Edited on 11-10-2014 by gnukid]

Jack Swords - 11-10-2014 at 05:09 PM

Australia's repeal of the carbon tax had nothing to do with Monckton's talks and were simply politics. To imply otherwise is misleading.

http://www.nytimes.com/2014/07/18/world/asia/environmentalis...

Jack Swords - 11-10-2014 at 05:17 PM

and...

http://www.theguardian.com/world/2014/jan/03/australias-hott...

gnukid - 11-10-2014 at 05:19 PM

Jack, why not provide some context for your point of view, as opposed to making far flung personal attacks.

Show that human generated CO2 has demonstrated causal affect on global temperature if that is your opinion and primary point of discussion.

Jack Swords - 11-10-2014 at 05:25 PM

Please don't take my postings as a personal attack, that is certainly not the intent. I have not been posting my opinion, simply contrary evidence to other's postings that enhance the discussion. This is an important topic that deserves rational discussion, but absolutely not if folks infer a personal agenda. That is not the case.

gnukid - 11-10-2014 at 05:31 PM

Great, I appreciate the open dialog about ecology.

Can you answer these question:


Is oil/gas a fossil fuel?

Is oil biotic or abiotic or both?

Is CO2 pollution or a life force necessary for our existence?

In past times of of higher CO2 ppm up to 1000 ppm were animals in danger?

Is there global warming over the last 18 years?

Are humans the cause of weather?

David K - 11-10-2014 at 06:00 PM

Thank you Jack...

The climate has always changed, and man didn't do it for 4 billion years, so why is man suddenly guilty now? Even just 30-40 years ago, the belief was we were going into a new ice age... The Soviets (Russians today) even proposed placing a large solar magnifier in orbit to warm up Siberia!

CO2 is what all plants breathe, without it the earth would be a dead planet... because plants make oxygen... which is what animals breathe.

Reduce CO2 if you are a plant hater... and an animal hater... or you just hate life (which seems to be the case of so many global warmists)!

Has any of these people been away from the city... out in the vast plains... or even better, in the ocean, out of sight of land? The world is mostly like that... Cities (populated places) make up a tiny area of this planet that to think this tiny area can change the plane'ts climate is preposterous.

WIWA

Sonora Wind - 11-10-2014 at 06:08 PM

While I Was Away. Several observations and such. The area between Hermosillo and Kino Bay was an under water sea plain several hundred thousand years ago. AKA globle warming. The Provo Bench in Utah was formed by thousands of years of wave action when the Great Salt Lake was way deeper than today. AKA Globle Cooling. There is a larger bench under the current Great Salt Lake, about a 100 feet lower than today. AKA Globle Warming like nothing you can imagine. All of this and countless warming and cooling cycles before man. The last really good rain we had here in California was in 1861/62. It rained for 42 and 1/2 days. The lake in Central Cal was 300 miles long and the state capital was under 30 feet of water. Al Gore was right when he said "Winters Coming". No wait that was the dwarf on Game of Thrones.:cool:

PS: If you really want to warm things up never mind all the carbon locked up in oil, coal and bio mass. Find a way to release all the carbon stored in the earths limestone. We're talkin globle cooking.

[Edited on 11-11-2014 by Sonora Wind]

Pompano - 11-10-2014 at 06:21 PM

Since this thread has pretty well lost any reference to Baja.....Has anyone been watching the US weather?

I'd stick my head out the door tonight if you live in much of the inner USA. It's damn cold out there and getting colder....much, much colder. Like 20-40 degrees below normal.

I'm on the US/Canada border and it's 1 F right now. We're going to be wishing for a little global warming damn soon. Manana I'll take some photos of the snowstorm.

[Edited on 11-11-2014 by Pompano]

gnukid - 11-10-2014 at 06:44 PM

Quote:
Originally posted by Jack Swords
and...

http://www.theguardian.com/world/2014/jan/03/australias-hott...


Another perspective on recent warm weather and crops..

AUSTRALIA

Honey Gold mango season launches with a record crop

http://www.freshplaza.com/article/130729/Honey-Gold-mango-se...

Record Australian cherry harvest could swamp market
http://www.canberratimes.com.au/act-news/record-australian-c...

NZ
NZ: building markets to support record avocado crop
http://www.freshfruitportal.com/2014/11/03/nz-building-marke...

UK
Perfect weather yields bumper cereal harvest for British farmers
http://www.theguardian.com/environment/2014/sep/05/hot-dry-w...

Ideal weather brings bumper English apple harvest
http://www.theguardian.com/environment/2014/oct/14/ideal-wea...

USA
Record crops stretching maximum capacity
http://www.argusleader.com/story/news/2014/11/03/record-crop...

Tomato Demand Spurs Record California Crop Amid Drought
http://www.bloomberg.com/news/2014-11-03/tomato-demand-spurs...

[Edited on 11-11-2014 by gnukid]

MitchMan - 11-10-2014 at 07:37 PM

This is much better than OT. Time and effort is obviously being spent gathering info and doing research and positing resourced info. Much superior to the frequent OT-like empty barrage of accusation and often unsupported and even undefended opinion alone.

We can agree to disagree, but we all learn stuff and that is a valued expenditure of time. I feel that you can always learn more by listening to both sides of an argument. Regardless of whichever side you are on, it makes you better if you listen to both sides.

Nomads rock!

Skipjack Joe - 11-10-2014 at 10:39 PM

Quote:
Originally posted by Pompano

Manana I'll take some photos of the snowstorm.


I, for one, will be looking for that. Beauty, at least, is not an inconvenient pleasure (no money involved) and therefore we can view it without bias.

wessongroup - 11-10-2014 at 10:43 PM

Dittos :):)

Skipjack Joe - 11-10-2014 at 11:06 PM

Originally posted by gnukid


1. Is oil/gas a fossil fuel?

Not all. Some oils are synthetic and some gases are not organic.

2. Is oil biotic or abiotic or both?

both.

3. Is CO2 pollution or a life force necessary for our existence?

Both. CO2 is like nitrates. Nitrates are required for plant carbon fixation but when present in large volume they will cause algal blooms and death to all other organic life. Similarly CO2 has side effects.

4. In past times of of higher CO2 ppm up to 1000 ppm were animals in danger?

Have no idea.

5. Is there global warming over the last 18 years?

Not sure, but 18 years is a meaningless amount of time for a process that occurs at a global level and therefore takes decades to build up. A 200 year temperature increase that coincides with the start of the industrial revolution is a more convincing time line. Don't forget that just a year ago DK produced a map showing arctic ice had increased in the last 6 months and decreed that global warming was over.

6. Are humans the cause of weather?

Unqualified to know. 97% say yes and 3% say no. I go with the 97%.

Cliffy - 11-11-2014 at 08:13 AM

OK question

Can anyone quantify and catalog the types of pollution from the volcano eruptions of the last 150 years and compare that to the same types and quantify the amounts emitted by mankind and the industrial complex over the same time period?

I'm willing to bet that the volcanoes emit far more in total tonnage than man has ever done.
Don't get me wrong. I'm not for uncontrolled pollution but the earth has a far greater capacity for recovery or "balance" than most care to explore JMO
What did someone say a few decades ago? FOLLOW THE MONEY?

elgatoloco - 11-11-2014 at 10:34 AM

What is copied and pasted below is based on science by scientists who study this stuff, you know the 97%, so I know at least 50% of those who read it might dismiss it off hand as :
1) feeble attempt to validate tax payer funded research
2) feeble attempt by the warped liberal latte drinking, prius driving, pinot sipping college professor science types to separate the right from their hard earned tax dollars for even more funded research
3) a conspiracy theory against all the good that volcanoes bring to mother earth
4) ______________________ fill in the blank

Respectfully - egl
------------------------------------------------------------------------------------------ Do volcanoes emit more CO2 than humans?

What The Science Says:
Humans emit 100 times more CO2 than volcanoes.


The solid Earth contains a huge quantity of carbon, far more than scientists estimate is present in the atmosphere or oceans. As an important part of the global carbon cycle, some of this carbon is slowly released from the rocks in the form of carbon dioxide, through vents at volcanoes and hot springs. Published reviews of the scientific literature by Mörner and Etiope (2002) and Kerrick (2001) report a minimum-maximum range of emission of 65 to 319 million tonnes of CO2 per year. Counter claims that volcanoes, especially submarine volcanoes, produce vastly greater amounts of CO2 than these estimates are not supported by any papers published by the scientists who study the subject.

The burning of fossil fuels and changes in land use results in the emission into the atmosphere of approximately 30 billion tonnes of carbon dioxide per year worldwide, according to the EIA. The fossil fuels emissions numbers are about 100 times bigger than even the maximum estimated volcanic CO2 fluxes. Our understanding of volcanic discharges would have to be shown to be very mistaken before volcanic CO2 discharges could be considered anything but a bit player in contributing to the recent changes observed in the concentration of CO2 in the Earth's atmosphere.


Volcanoes can--and do--influence the global climate over time periods of a few years but this is achieved through the injection of sulfate aerosols into the high reaches of the atmosphere during the very large volcanic eruptions that occur sporadically each century. But that's another story...

Recommended further reading on CO2 and volcanoes can be found here: Terry Gerlach in Earth Magazine ; USGS

David K - 11-11-2014 at 10:50 AM

When the ozone scare/ hole failed destroy the earth and only got some aerosols banned... even though volcanoes fill the skies with ozone depleting gasses. The earth survived.

Then the left switched to blaming cows and the meat/ dairy industry saying cow farts would destroy the earth. We wouldn't all become vegan, sorry again, and the earth is still here!

Next try to control our lives, the left calls Carbon Dioxide deadly to life on earth! Just that CO2 and is not a 'pollutan't... worldwide plant growth increases thanks to it, and the result is more oxygen.

I have yet to hear the left scream to ban smoking marijuana... has anyone measured what it adds to pollution figures, with it being legalized more and more? :wow:

elgatoloco - 11-11-2014 at 11:27 AM

Quote:
Originally posted by David K
I have yet to hear the left scream to ban smoking marijuana... has anyone measured what it adds to pollution figures, with it being legalized more and more? :wow:


Whats Michael Savage's take on that? Dying to hear it.

willardguy - 11-11-2014 at 11:56 AM

a little trivia, Michael Savage's real name is Michael Weiner. guess the name of his show "weiner nation" didn't have the ring he was lookin for!:lol:

wessongroup - 11-11-2014 at 12:42 PM

Polar Vortex

"A study in 2001 found that stratospheric circulation can have anomalous effects on weather regimes.[28] In the same year researchers found a statistical correlation between weak polar vortex and outbreaks of severe cold in the Northern Hemisphere.[29][30] In more recent years scientists identified interactions with Arctic sea ice decline, reduced snow cover, evapotranspiration patterns, NAO anomalies or weather anomalies which are linked to the polar vortex and jet stream configuration.[28][30][31][32][33][34][35][36] However, because the specific observations are considered short-term observations (starting c. 13 years ago) there is considerable uncertainty in the conclusions. Climatology observations require several decades to definitively distinguish natural variability from climate trends.


Southern Hemisphere Ozone Concentration, February 22, 2012
The general assumption is that reduced snow cover and sea ice reflect less sunlight and therefore evaporation and transpiration increases, which in turn alters the pressure and temperature gradient of the polar vortex, causing it to weaken or collapse. This becomes apparent when the jet stream amplitude increases (meanders) over the northern hemisphere, causing Rossby waves to propagate farther to the south or north, which in turn transports warmer air to the north pole and polar air into lower latitudes. The jet stream amplitude increases with a weaker polar vortex, hence increases the chance for weather systems to become blocked. A recent blocking event emerged when a high-pressure over Greenland steered Hurricane Sandy into the northern Mid-Atlantic states.[37]"

http://en.wikipedia.org/wiki/Polar_vortex

Polar Amplification

Polar amplification refers to the observation that any change in the net radiation balance (for example greenhouse intensification) then tends to produce a larger change in temperature near the poles than the planetary average.[1] On a planet with an atmosphere that can restrict longwave radiation to space (a greenhouse effect), surface temperatures will be warmer than a simple planetary equilibrium temperature calculation would predict. Where the atmosphere or an extensive ocean is able to convect heat polewards, the poles will be warmer and equatorial regions cooler than their local net radiation balances would predict.[2]

In the extreme, the planet Venus is thought to have experienced a very large increase in greenhouse effect over its lifetime,[3] so much so that its poles have warmed sufficiently to render its surface temperature effectively isothermal (no difference between poles and equator).[4][5] On earth, water vapor and trace gasses provide a lesser greenhouse effect, and the atmosphere and extensive oceans provide efficient poleward heat transport. Both palaeoclimate changes and recent global warming changes have exhibited strong polar amplification, as described below.

http://en.wikipedia.org/wiki/Polar_amplification

Its the "environment" silly ... :biggrin::biggrin:

And it all adds up ... one way or another when taken as a "whole" ...

Pot as a major contributor to climate change ... a different thought, in environmental quantitive measurements of pollutions produced by man and/or women into the "environment" :biggrin::biggrin:

Stick with numbers which have been found through science and are "empirical"

Great discussion ... thanks to all

Hey, how about the increase CO2 that people will generate from having medical insurance under the new law, more people using transportation to go to the doctors ... it all adds up

"you don’t need a weatherman
To know which way the wind blows"

Read more: http://www.bobdylan.com/us/songs/subterranean-homesick-blues...

motoged - 11-11-2014 at 01:53 PM

Quote:
Originally posted by David K
...Then the left switched to blaming cows and the meat/ dairy industry saying cow farts would destroy the earth. .....

I have yet to hear the left scream to ban smoking marijuana... has anyone measured what it adds to pollution figures, with it being legalized more and more? :wow:


Oh, David....you are such a "hater".

Go spark one up and chill....then measure the effects and report back to us :biggrin:

wessongroup - 11-11-2014 at 02:44 PM

Hey, I want to ... too :lol::lol:

As for those concerns about China ...

Bet that took some of the "steam" out of "Bama's" sails ...

China moves quicker on things ... they are Chinese after all ... a very great people

They just needed a helping hand, to take over the world ... :D :D

US, China unveil ambitious climate change goals

http://www.boston.com/business/news/2014/11/12/china-unveil-...

[Edited on 11-12-2014 by wessongroup]

redhilltown - 11-12-2014 at 01:16 AM

Quote:
quote]Originally posted by willardguy
a little trivia, Michael Savage's real name is Michael Weiner. guess the name of his show "weiner nation" didn't have the ring he was lookin for!:lol:


Yeah...he is such a tough guy. All those years of hard core military service and he still doesn't have the guts to use his real name.

[Edited on 11-12-2014 by redhilltown]

[Edited on 11-12-2014 by redhilltown]

wessongroup - 11-13-2014 at 12:09 PM

Believe this would apply to Baja too


When sitting around a campfire having a few ... :biggrin::biggrin:

And DK ... think Israel has taken care of your concerns about "Mota" ... and the Green House Effect

Israeli Company 3D Printed a Marijuana Inhaler

http://3dprinting.com/products/israeli-company-3d-printed-a-...

making a buck off ........ of Environmental Concerns ... Its the American way .. :biggrin::biggrin:

[Edited on 11-13-2014 by wessongroup]

David K - 11-19-2014 at 07:36 PM

Here is something to nibble on...

The COLD Truth

[Edited on 11-20-2014 by David K]

wessongroup - 11-19-2014 at 07:52 PM

"Using their own data, John has proven" .... well that should button it up ... HUH

Too bad they didn't share that "data" in the article :):)

Say, how's that Polar Vortex thingy working out ...

[Edited on 11-20-2014 by wessongroup]

 Pages:  1  2