This graph, based on the comparison of atmospheric samples contained in ice cores and more recent direct measurements, provides evidence that
atmospheric CO2 has increased since the Industrial Revolution. (Credit: Vostok ice core data/J.R. Petit et al.; NOAA Mauna Loa CO2 record.)
These findings are based on samples taken and subsequent laboratory analysis to determine what existed in the atmosphere at various times in history
It shows clearly that there is in fact an increase of CO2 production , by man, into the atmosphere and is and will have an impact
Global Analysis - September 2014
Global Highlights
The combined average temperature over global land and ocean surfaces for September 2014 was the highest on record for September, at 0.72°C (1.30°F)
above the 20th century average of 15.0°C (59.0°F).
The global land surface temperature was 0.89°C (1.60°F) above the 20th century average of 12.0°C (53.6°F), the sixth highest for September on record.
For the ocean, the September global sea surface temperature was 0.66°C (1.19°F) above the 20th century average of 16.2°C (61.1°F), the highest on
record for September and also the highest on record for any month.
The combined global land and ocean average surface temperature for the JanuarySeptember period (year-to-date) was 0.68°C (1.22°F) above the 20th
century average of 14.1°C (57.5°F), tying with 1998 as the warmest such period on record.
Besides being garbage it looks as though this video has been doctored. To me it looks like it's been edited and spliced.
Quantitative
Quote:
Originally posted by wessongroup
Quote:
Originally posted by gnukid
This graph, based on the comparison of atmospheric samples contained in ice cores and more recent direct measurements, provides evidence that
atmospheric CO2 has increased since the Industrial Revolution. (Credit: Vostok ice core data/J.R. Petit et al.; NOAA Mauna Loa CO2 record.)
These findings are based on samples taken and subsequent laboratory analysis to determine what existed in the atmosphere at various times in history
It shows clearly that there is in fact an increase of CO2 production , by man, into the atmosphere and is and will have an impact
Global Analysis - September 2014
Global Highlights
The combined average temperature over global land and ocean surfaces for September 2014 was the highest on record for September, at 0.72°C (1.30°F)
above the 20th century average of 15.0°C (59.0°F).
The global land surface temperature was 0.89°C (1.60°F) above the 20th century average of 12.0°C (53.6°F), the sixth highest for September on record.
For the ocean, the September global sea surface temperature was 0.66°C (1.19°F) above the 20th century average of 16.2°C (61.1°F), the highest on
record for September and also the highest on record for any month.
The combined global land and ocean average surface temperature for the JanuarySeptember period (year-to-date) was 0.68°C (1.22°F) above the 20th
century average of 14.1°C (57.5°F), tying with 1998 as the warmest such period on record.
Coldest summer on record at the North Pole
Highest August Arctic ice extent since 2006
Record high August Antarctic ice extent
No major hurricane strikes for eight years
Slowest tornado season on record
No global warming for 17 years
Second slowest fire season on record
Four of the five snowiest northern hemisphere winters have occurred since 2008
Outstanding ... one day of sampling, lets move with those findings for the entire earth ... or Gores electric bill ....
the other graph represents 650,000 years of sample data which clearly demostrates the increase in CO2 emission over the past 150 plus years
Quote:
Originally posted by wessongroup
Qualitative
Quote:
Originally posted by Skipjack Joe
Quote:
Originally posted by gnukid
I'm ashamed to say I watched this garbage.
Besides being garbage it looks as though this video has been doctored. To me it looks like it's been edited and spliced.
Quantitative
Quote:
Originally posted by wessongroup
Quote:
Originally posted by gnukid
This graph, based on the comparison of atmospheric samples contained in ice cores and more recent direct measurements, provides evidence that
atmospheric CO2 has increased since the Industrial Revolution. (Credit: Vostok ice core data/J.R. Petit et al.; NOAA Mauna Loa CO2 record.)
These findings are based on samples taken and subsequent laboratory analysis to determine what existed in the atmosphere at various times in history
It shows clearly that there is in fact an increase of CO2 production , by man, into the atmosphere and is and will have an impact
Global Analysis - September 2014
Global Highlights
The combined average temperature over global land and ocean surfaces for September 2014 was the highest on record for September, at 0.72°C (1.30°F)
above the 20th century average of 15.0°C (59.0°F).
The global land surface temperature was 0.89°C (1.60°F) above the 20th century average of 12.0°C (53.6°F), the sixth highest for September on record.
For the ocean, the September global sea surface temperature was 0.66°C (1.19°F) above the 20th century average of 16.2°C (61.1°F), the highest on
record for September and also the highest on record for any month.
The combined global land and ocean average surface temperature for the JanuarySeptember period (year-to-date) was 0.68°C (1.22°F) above the 20th
century average of 14.1°C (57.5°F), tying with 1998 as the warmest such period on record.
Coldest summer on record at the North Pole
Highest August Arctic ice extent since 2006
Record high August Antarctic ice extent
No major hurricane strikes for eight years
Slowest tornado season on record
No global warming for 17 years
Second slowest fire season on record
Four of the five snowiest northern hemisphere winters have occurred since 2008
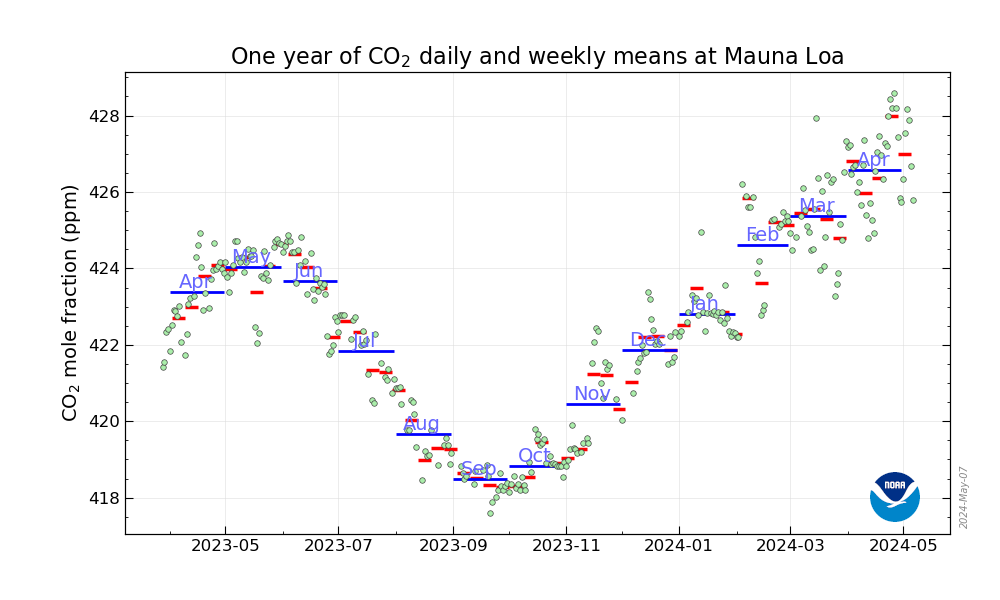
Shame on you gnukid. I went to the source you provided -
And found that you had chosen a weekly report to post here when there was the following historic report right next to it which you chose not to post.
You have a history of cherry picking data from the internet and presenting them here to numerically prove something.
I suggest you stick to Mauna Loa macademia nuts. Something you are more suited for.
Clearly, there is change in CO2 ppm, however, attributing the increase to global climate change is not likely, more likely the opposite temperature
drives CO2.
Note that in prehistoric times, before industrialization, CO2 was in much higher ppm during periods of greater diversity. CO2 feeds plants which feeds
animals. CO2 is life force. Furthermore, note that CO2 is a very minor atmospheric gas.
Now let's focus on reducing actual pollution we can control, such as military weapons detonation, agricultural poison, medical waste dumping, nuclear
waste and geo-engineering.
Again the time frame is 650,000 years, which would take one back to the (Calabrian is a subdivision of the Pleistocene Epoch of the Geologic time
scale. ~1.8 Ma.781,000 years ago ± 5,000 years, a period of ~1.019 million years.) which has not confirmed the "theory" that Greenhouse Effect was on
going at anytime for at lest the last 650,000, through scientific sampling with results which in fact support the contention that man has, since the
development of the internal combustion engine and the subsequent need for "oil" has lead us to the point in time today and is also illustrated in the
graph below
The fact is that there has been increased pollutants in our environment from man's progress in the fields of Chemistry and/or Industrialization
Hence the need for the Environmental Protection Agency in 1970, along with a long list of other agencies and Laws and regulations to "manage" to some
degree the negative impact of same to: earth, air, water, fauna and flora over the past 50 years
The first forceful example of "industrialization" vast impact on the planet was the findings in the early 60's ... showing just how wide the impact of
just one chemical (DDT) was having on various living organisms within the environment .. Its use was discontinued in the United States, however, it is
still use due to its cost and effectiveness in some areas of the world still, mostly in the very poor countries ... and has a tolerance established
for how much one can eat with their food, as it is persistence in the environment ... the "parent" ai and its metabolites
That there are countless example of negative environment impacts to the soil, water and air from industrialization should not be in dispute, rather
the quantity of "substances" which are introduced, daily, weekly, monthly, yearly ... et al that have a negative impact, measured by science, not
talking heads
Personally, I'd rather not wait until the "rivers" are catching fire again, or large areas are made unusable from contamination ... and that would
apply to the: soil, water and air ... they are necessary to grow food, provide shelter, medicines et al, but not at the cost of an environment which
allows us to exist in the life form we know as "humans"
Quote:
Originally posted by wessongroup
Quote:
Originally posted by gnukid
This graph, based on the comparison of atmospheric samples contained in ice cores and more recent direct measurements, provides evidence that
atmospheric CO2 has increased since the Industrial Revolution. (Credit: Vostok ice core data/J.R. Petit et al.; NOAA Mauna Loa CO2 record.)
Global Analysis - September 2014
Global Highlights
The combined average temperature over global land and ocean surfaces for September 2014 was the highest on record for September, at 0.72°C (1.30°F)
above the 20th century average of 15.0°C (59.0°F).
The global land surface temperature was 0.89°C (1.60°F) above the 20th century average of 12.0°C (53.6°F), the sixth highest for September on record.
For the ocean, the September global sea surface temperature was 0.66°C (1.19°F) above the 20th century average of 16.2°C (61.1°F), the highest on
record for September and also the highest on record for any month.
The combined global land and ocean average surface temperature for the JanuarySeptember period (year-to-date) was 0.68°C (1.22°F) above the 20th
century average of 14.1°C (57.5°F), tying with 1998 as the warmest such period on record.
These are quantitative "facts" which were developed from scientific investigation, which just didn't start yesterday
Our environment is better defined today compare to 50 years ago, not forgetting the instrumentation which was not around 50 years ago... as, there was
concern from some and the arguments haven't changed IMHO ... trust me
No argument on the need to "control" pollution, from many sources which have negative impact on our environment ... it the right thing to do for life
and common sense
Sorry if the "facts" are upsetting to some ... but, since you asked ... here's the graph is again ... along with a graph on oil production from the
1930s to 2013 in barrels per day production
Isn't that amazing the graph of increased oil production is reflected in the graph of CO2 increase ...
Naw, couldn't be a scientific relationship between oil production and use, with increased CO2 levels being detected in our "atmosphere"
And GMO's isn't a bad one to bring up either ... or how about "Bees" ... or _____
Hey, its Friday ... have a great weekend ...
This graph, based on the comparison of atmospheric samples contained in ice cores and more recent direct measurements, provides evidence that
atmospheric CO2 has increased since the Industrial Revolution. (Credit: Vostok ice core data/J.R. Petit et al.; NOAA Mauna Loa CO2 record.)
The Preindustrial and/or Industrial Revolution changed everything with the development of the internal combustion engine it was all over .. in
1859
"The first commercially successful internal combustion engine was created by Étienne Lenoir around 1859.[1]
Scientific American advised in September 1860 the Parisian newspaper Cosmos had pronounced the steam age over,[5]
"If it were lush and rich, one could understand the pull, but it is fierce and hostile and sullen.
The stone mountains pile up to the sky and there is little fresh water. But we know we must go back
if we live, and we don't know why." - Steinbeck, Log from the Sea of Cortez
"People don't care how much you know, until they know how much you care." - Theodore Roosevelt
"You can easily judge the character of others by how they treat those who they think can do nothing for them or to them." - Malcolm Forbes
"Let others lead small lives, but not you. Let others argue over small things, but not you. Let others
cry over small hurts, but not you. Let others leave their future in someone else's hands, but not you." - Jim Rohn
"The best way to get the right answer on the internet is not to ask a question; it's to post the wrong answer." - Cunningham's Law
Thankyou to Baja Bound
Mexico InsuranceServices for your long-term support of the BajaNomad.com Forums site.
Emergency Baja Contacts Include:
Desert Hawks;
El Rosario-based ambulance transport; Emergency #: (616) 103-0262